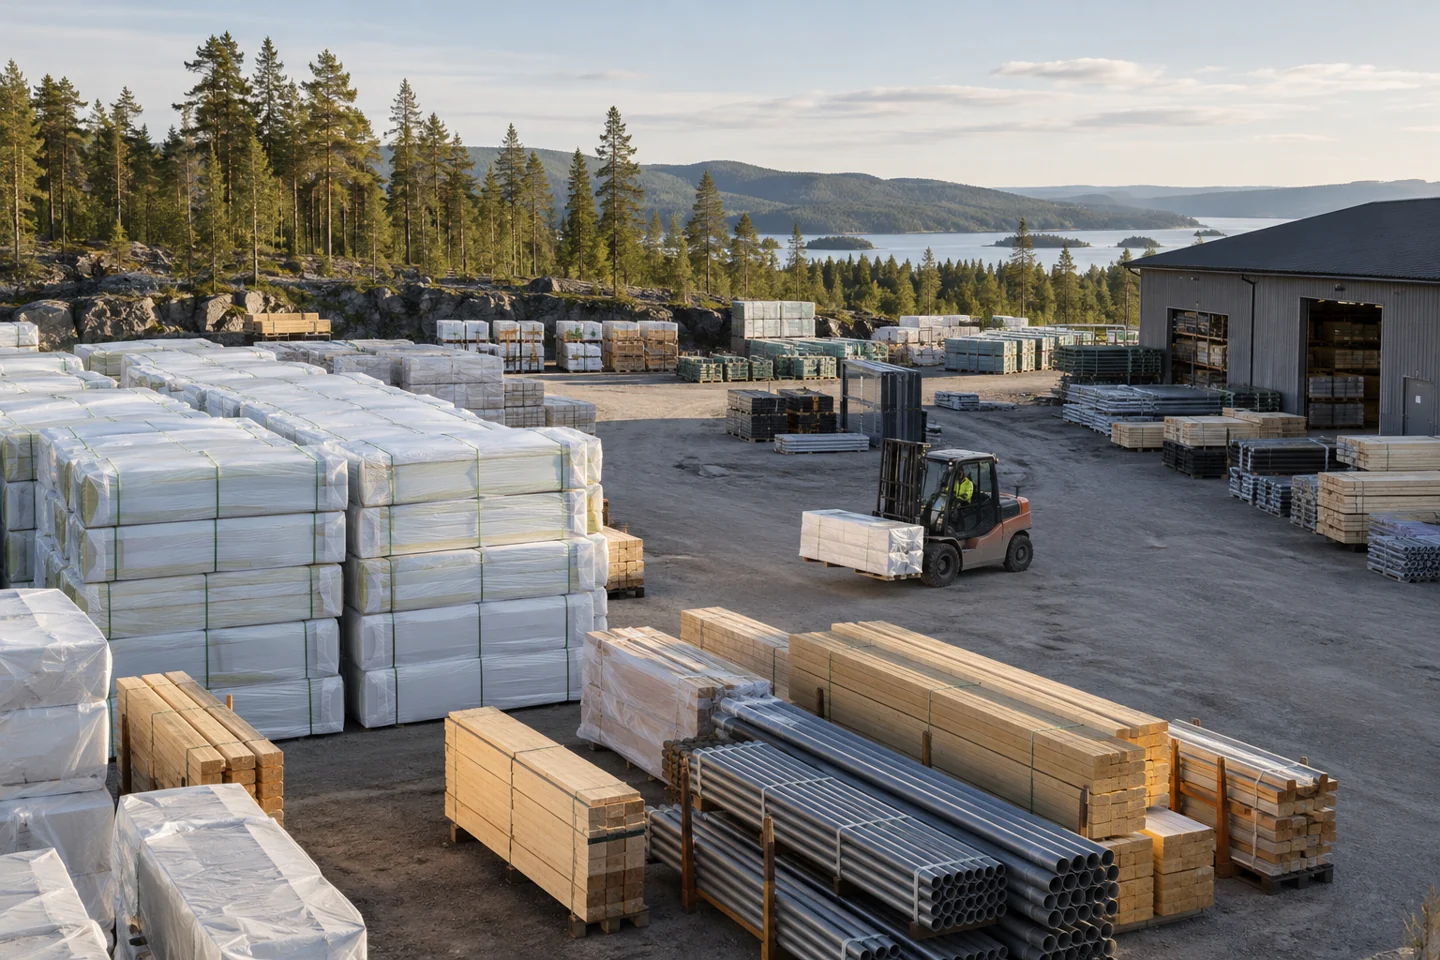
Improve footprint, supply chain and logistics, sourcing and operational excellence. We help Nordic companies translate operational choices into stronger margins, better service and lower capital employed.
Industrial production
Operational choices. Measurable impact.
From network design to daily execution, we work with your teams across four connected areas. Each starts with the economics and ends with changes the business can deliver.
01
Footprint
The right activities. In the right places.
Shape a network that supports the customer promise and earns its cost of capital—from manufacturing plants and warehouses to retail stores, branches and service locations.
Manufacturing footprint: site roles, capacity allocation, specialisation, consolidation and expansion.
Retail and service networks: catchment coverage, location economics, formats, openings, closures and partner models.
Network scenarios: total landed cost, capital requirements, make-or-buy choices and phased transfers with continuity safeguards.
Better capacity utilisation, lower network cost and stronger returns on capital.
Site profitability · Capacity utilisation · Coverage · ROCE
02
Supply Chain & Logistics
Better flow. More reliable delivery.
Connect demand, supply, inventory and fulfilment. Improve service and resilience while reducing the cost and cash tied up in getting products to customers.
Sales and operations planning, demand forecasting, supply planning and inventory policies.
Warehouse and distribution design, transport flows, carrier strategy and fulfilment productivity.
Cost to serve by customer and channel, lead-time reduction, working capital and supply-risk mitigation.
More reliable delivery, lower logistics cost and less cash tied up in stock.
On-time, in-full delivery · Inventory days · Lead time · Cost to serve
03
Sourcing
More value from every supplier relationship.
Improve direct and indirect procurement through stronger category strategies, supplier choices and commercial execution. Connect negotiated terms to value realised in the business.
Spend transparency, category strategies, demand and specification optimisation, and total cost of ownership.
Competitive tenders, supplier negotiations, consolidation and make-or-buy decisions.
Supplier performance and resilience, contract compliance and savings realisation with finance and the line.
Lower total cost, stronger supply assurance and savings that reach the P&L.
Improve how work is planned, performed and managed across factories, warehouses, stores and service operations. Build the capabilities and routines that sustain the gains.
Lean flow, bottleneck removal, standard work, capacity and workforce planning.
Quality, yield, maintenance and asset reliability, with automation where the business case supports it.
Daily performance management, frontline problem solving, visual KPIs and capability building.
Higher throughput and productivity, better quality and more dependable operations.
Our proprietary AI platform supports scenario analysis, spend classification and performance diagnostics. Partners and operating specialists validate findings with your teams and turn them into practical decisions.
When needed
The network no longer fits the business
Demand shifts, acquisitions or changing channels leave duplicated sites, weak locations or capacity in the wrong places.
Service suffers while inventory and cost rise
Stockouts, excess stock, long lead times and expediting point to disconnects between planning, supply and fulfilment.
Procurement savings stop at the negotiation table
Fragmented spend, inconsistent specifications and weak compliance prevent better terms from translating into lower cost.
Performance varies too much between sites
Productivity, quality and asset availability differ despite comparable work, and local improvements are difficult to sustain or scale.
Our approach
Four steps take the work from framing the question to executing the agreed changes, with service-specific activities and a decision gate at the end of each step. We agree the scope, evidence requirements and owners for each phase before work starts.
Duration: 1–2 weeks
Step 1: Frame
Agree the operational challenge, scope and financial ambition. Define customer-service requirements, baseline measures and the sites, categories or flows to examine.
Gate 1
Sponsor and operating leaders agree the scope, constraints, data access and measures of success.
Duration: 4–8 weeks
Step 2: Diagnose
Combine data analysis with observation on the ground. Build site, flow and category economics; identify bottlenecks and compare footprint, sourcing and performance options.
Gate 2
Operations and finance accept the baseline and a prioritised view of opportunities, assumptions and risks.
Duration: 2–4 weeks
Step 3: Validate
Test changes with frontline teams and suppliers. Validate scenarios and pilots, quantify investment and transition costs, and sequence the plan around service continuity.
Gate 3
Line owners and finance approve business cases, funding, implementation responsibilities and launch conditions.
Duration: 3–12+ months
Step 4: Execute
Work side by side with site and functional leaders to implement changes, strengthen daily management and build capabilities. Track service, productivity and financial realisation together.
Gate 4
Owners accept each rollout and handover; finance validates the benefits against the agreed baseline.
Deliverables
01
Step 1: Frame
Operations mandate and performance baseline
An agreed scope and KPI tree linking service, quality, productivity and capital to financial outcomes. Set owners, constraints and measurement rules before analysing improvements.
02
Step 2: Diagnose
Network scenarios and improvement portfolio
A fact base on site economics, material flows, spend and operating performance. Compare options on cost, service, resilience and capital, with benefits and assumptions made explicit.
03
Step 3: Validate
Validated business cases and transition plan
Pilot evidence and initiative business cases with net savings, working-capital release, investment, payback and delivery risks. Sequence changes with clear owners and continuity safeguards.
04
Step 4: Execute
Performance system and value tracker
Working site and supplier scorecards, daily management routines and a rollout plan. Track recurring P&L benefits separately from cash release and one-off costs, with finance validation.
Each phase leaves a working asset with an owner, source references and an update process. Economic estimates distinguish potential value from approved commitments and realised results.
Illustrative example
Operational value scorecard
Connect footprint, flow, sourcing and productivity initiatives to operating measures, financial value and accountable owners.
Sample data, not a client deliverable. The format is tailored to the engagement.
You get direct access to partner judgement, a team working inside your business and a shared focus on economic impact. We work through the difficult questions with you and stay close as decisions become action.
A senior team, working with you
Partner judgement at the problem-solving table
1 accountable partner. Works directly on your hardest questions: shaping hypotheses, examining the evidence and developing recommendations with your team. Regular joint working sessions and partner-led decision gates bring senior judgement into the work throughout the engagement.
Day-to-day momentum, inside your business
1 Engagement manager. Works side by side with your people, including from your offices. Connects the analysis to operational reality, resolves blockers and turns decisions into owned actions.
Analytical depth focused on value
2–3 consultants. Combine rigorous analysis with our proprietary AI harness to test opportunities, quantify the economics and build practical working assets with your team. You gain a stronger fact base and tools your people can keep using.
Expertise that makes recommendations practical
1 expert. Brings relevant industry or service experience to test assumptions, challenge feasibility and identify the constraints that matter before you commit resources.
Duration & Fees
A clear path from question to impact
Duration of each step: Frame: 1–2 weeks. Diagnose: 4–8 weeks. Validate: 2–4 weeks. Execute: 3–12+ months. Durations depend on scope: a focused sourcing sprint can move faster; site transfers may take longer. We agree the scope, owners and decision gates before work starts.
Continuity from insight to execution
The partner and engagement manager are planned to stay from Frame through Execute, carrying the context and accountability into implementation. Any change to the core team is discussed and agreed with you.
Fee certainty upfront. Alignment on results.
Steps 1–3 (Frame, Diagnose and Validate) are fixed-fee, with scope and deliverables agreed for each step. Execute can include performance-based fees linked to agreed outcomes, baselines and measurement rules.
You control the next commitment
At each decision gate, choose to proceed, adjust the scope or take the working assets forward with your own team. Each further commitment follows an explicit decision, with ownership and handover built into the work.
Cases
Selected anonymised engagements. Many span several services; each case shows the relevant areas of work alongside its outcome.
Industrials · Operating Model · Strategic Decisions · Cost Out · Operations
Five manufacturing sites with a 3:1 spread in fully loaded unit cost.
Timeframe
Phased transfers; revalidation required 9–18 months per product line.
Recorded facts and outcomes
Consolidation from five sites to three, with approximately EUR 18m annual cost reduction at full run-rate.
Judgement, targets and limits
The annual reduction is stated at full run-rate; it is not an in-year cash saving. Regulatory and transfer risks shaped the sequence.
European postal and logistics operator
Starting position
Several hundred service locations serving declining counter volumes; approximately one-third were loss-making at site level.
Timeframe
The case does not specify the programme duration.
Recorded facts and outcomes
Network cost was reduced by approximately EUR 13m p.a., while regulated population coverage was maintained through partner conversion.
Judgement, targets and limits
The result relates to this service network. Store and network decisions depend on local economics and coverage requirements.
European construction group
Starting position
Approximately EUR 530m of fragmented indirect spend; the top 20 categories covered 60% of spend.
Timeframe
Category renegotiation and consolidation waves; duration is not specified in the case.
Recorded facts and outcomes
Approximately EUR 43m of negotiated savings, or 8% of addressable spend, with compliance tracking established.
Judgement, targets and limits
Negotiated savings are distinct from subsequent P&L or cash realisation, which this case does not separately quantify.
Passenger rail operator
Starting position
Fleet availability in the mid-80s against a target above 90%, with approximately EUR 130m annual maintenance cost.
Timeframe
Maintenance strategy and implementation planning; duration is not specified in the case.
Recorded facts and outcomes
A reliability-driven maintenance concept, depot and workshop footprint, and make-or-buy position were developed. Heavy overhaul was confirmed for external sourcing.
Judgement, targets and limits
The +4 percentage-point availability improvement and approximately EUR 13m annual cost reduction describe the ambition, not a verified realised result.
Figures are approximate. EUR conversions are documented in the full cases. These engagements illustrate experience, not forecasts for a new assignment.
Other services
Clarify responsibilities, governance and organisational interfaces
If the operational choices are clear, line owners have the capacity and skills to deliver, and finance can track the benefits, build on your existing improvement programme.
Talk it through with a partner.
Start with a conversation about where operations could create more value. We can share a perspective on your footprint, supply chain, sourcing or frontline performance, and discuss what the opportunity could mean for your business.