Revenue grows while contribution stalls
Discounts, mix or cost to serve are absorbing the benefit.

We help CEOs and commercial leaders turn pricing, customer and channel choices into profitable growth with a clear route to execution.


Discounts, mix or cost to serve are absorbing the benefit.
Realised prices diverge from the approved increase, and the leakage is not explained.
The entry case rests on an untested win rate, channel model or local cost structure.
New roles have not changed account priorities, conversion or commercial behaviour.
Four steps take the work from framing the question to executing the agreed changes, with service-specific activities and a decision gate at the end of each step. We agree the scope, evidence requirements and owners for each phase before work starts.
Duration: 1–2 weeks
Connect revenue, discounts and cost to serve at customer, product and channel level.
Revenue reconciles to finance reporting; exclusions and gaps in contribution data are explicit.
Duration: 8–12 weeks
Test segment, price and channel hypotheses with commercial teams and customer evidence.
Finance and the commercial sponsor sign off the opportunity logic; the partner distinguishes facts from demand assumptions.
Duration: 4–6 weeks
Test the selected pricing or sales changes in a bounded cohort before expansion.
Pilot results are compared with the agreed baseline or comparison cohort; rollout requires sponsor approval.
Duration: 6–18 months
Roll out validated pricing, sales and channel changes in waves. Coach teams and track contribution, retention and conversion against the agreed baseline.
Commercial owners approve each rollout wave; finance validates the margin impact and line teams accept ongoing ownership.
Step 1: Frame
An agreed scope of customers, products and channels, with revenue and contribution definitions, data requirements, pilot measures and accountable commercial owners.
Step 2: Diagnose
A reconciled view of price, volume, mix, discounts and cost to serve. Size incremental contribution by opportunity, including cost to implement, customer risk and the assumptions behind each estimate.
Step 3: Validate
A pricing, sales or channel pilot assessed against an agreed baseline or comparison cohort. Document realised price, conversion, retention and contribution, with scale-up economics and acceptance criteria.
Step 4: Execute
Account and channel actions with owners, milestones and adoption measures. Track incremental contribution and implementation costs against the business case, distinguishing growth from profitable growth.
Each phase leaves a working asset with an owner, source references and an update process. Economic estimates distinguish potential value from approved commitments and realised results.
Illustrative example
See how price, mix, discounts and cost to serve change contribution margin, then pinpoint the customer segments that need action.
Sample data, not a client deliverable. The format is tailored to the engagement.
View full-size example ↗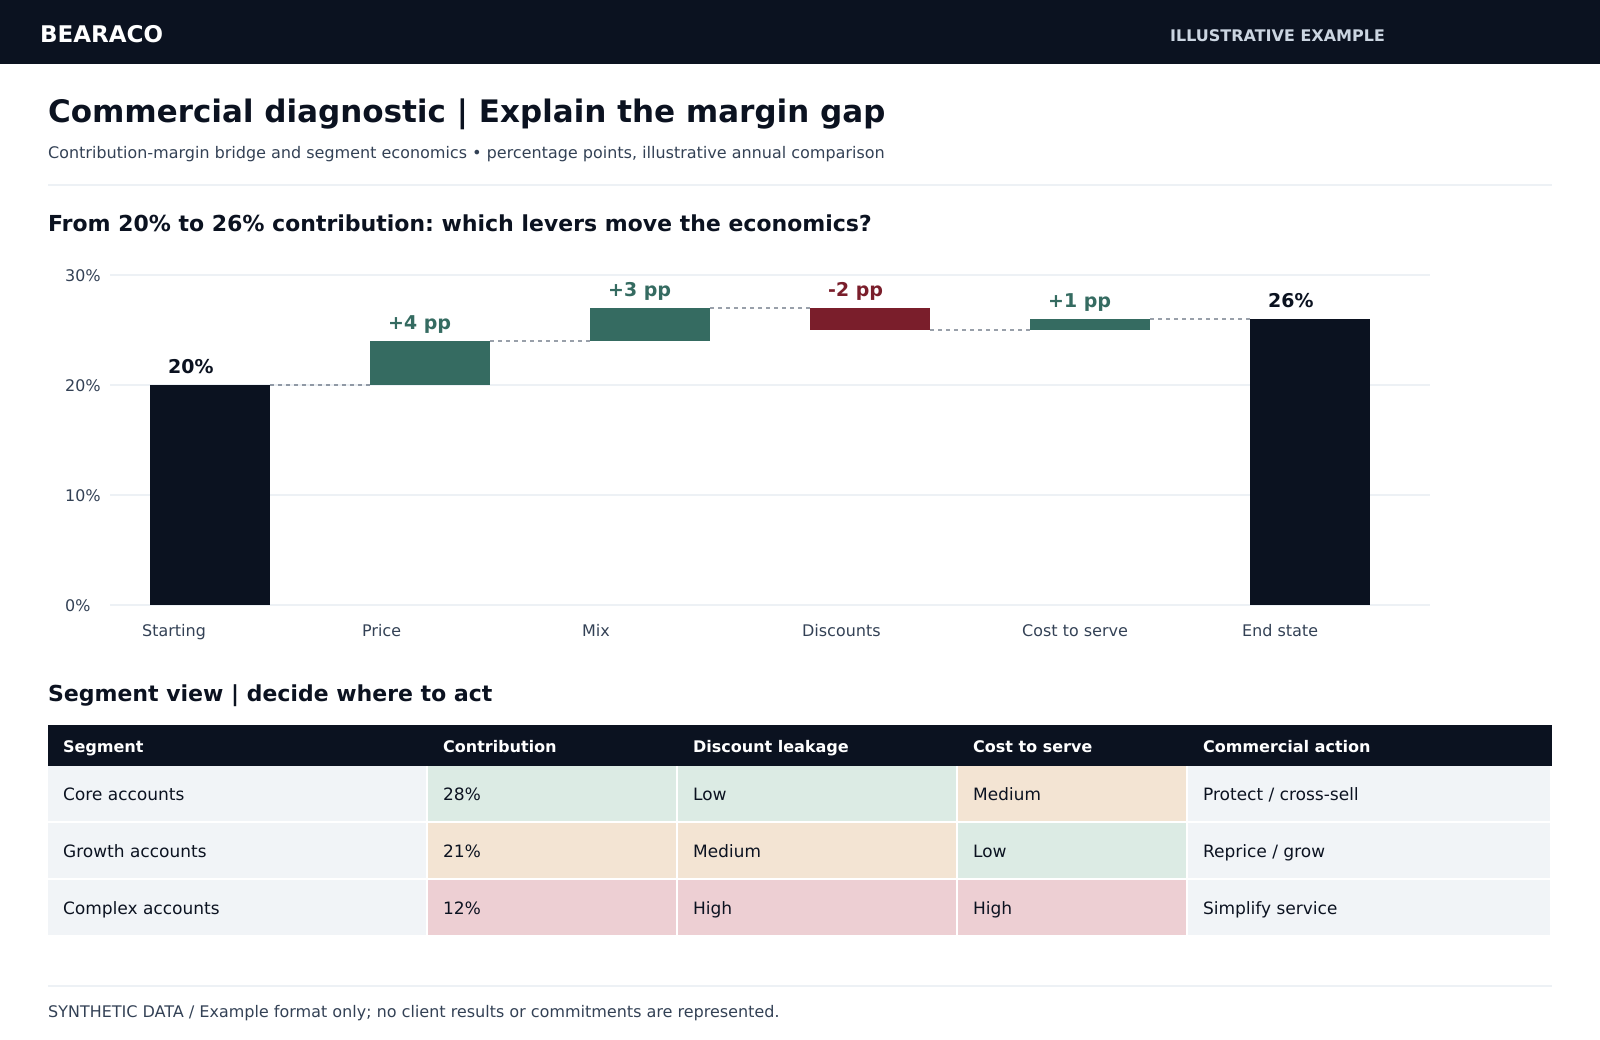
You get direct access to partner judgement, a team working inside your business and a shared focus on economic impact. We work through the difficult questions with you and stay close as decisions become action.
Selected anonymised engagements. Many span several services; each case shows the relevant areas of work alongside its outcome.

Consumer & Retail · Growth & Commercial · Cost Out
Privately held vehicle parts distributor

Industrials · Growth & Commercial · Strategic Decisions
Global rolling stock manufacturer

Industrials · Strategic Decisions · Growth & Commercial
Listed precision medical technology manufacturer
Figures are approximate. EUR conversions are documented in the full cases. These engagements illustrate experience, not forecasts for a new assignment.
If your team already knows the source of leakage and can test a bounded change with reliable measurement, run the pilot internally before commissioning a wider programme.